Fertility Rate & Population Decline: The Complete UPSC Guide
Syllabus Connection: GS Paper I, II & III
GS Paper 1: Population and associated issues, demographic transition theory, and developmental issues.
GS Paper 2: Social sector management relating to health, education, and human resources.
GS Paper 3: Indian Economy and issues relating to planning, mobilization of resources, growth, and employment (realizing demographic dividend vs dependency ratios).
Four Key Factors Driving Population Transition
Even after fertility rates fall below replacement levels, a population does not instantly shrink. The timeline of transition depends on four distinct demographic forces:
Shows the average number of live births per woman. Below 2.1 means each generation is smaller than the one before it.
Shows how young or old the population is. Younger countries can keep adding people for years even after fertility falls.
Shows how long people live. Rising life expectancy can delay decline by keeping deaths lower for longer.
Shows population gains from immigration and losses from emigration. Migration can either offset or speed up decline.
"Even after fertility falls below replacement, a young population can keep growing for decades. India may follow that path—but not necessarily for as long as UN projections suggest."
— Atul Thakur, Demographic Analyst
57 Shrinking, 131 Below Replacement: The Global Scale of Decline
In 2026, 57 of the 242 countries and territories in UN projections are expected to record more deaths than births. But low fertility is already far more widespread: 131 countries and territories now have fertility rates below the replacement level of 2.1.
China is the starkest case. Under the UN's medium-fertility scenario, deaths in China are projected to exceed births by about 29 lakh in 2026. A steeper fertility decline would push more countries into natural population decrease. Several advanced economies are also expected to record more than one lakh excess deaths over births.
| Country | Births minus deaths (lakh, 2026) | Trend & Impact |
|---|---|---|
| China | -28.6 | Rapid workforce contraction; accelerating demographic transition |
| Japan | -8.2 | Severe post-industrial ageing; rural depopulation |
| Russia | -6.6 | Long-term depopulation compounded by geopolitical conflicts |
| Germany | -3.5 | Ageing offset heavily by immigration requirements |
| Italy | -2.9 | Super-aged society; lowest birth records in Southern Europe |
| Ukraine | -2.9 | Severe war-induced demographic displacement & low birth rates |
| Poland | -1.4 | Persistent low fertility and youth emigration |
| South Korea | -1.4 | World's lowest TFR; rapid path to population collapse |
| Spain | -1.3 | Southern European low-fertility trap; rising care demands |
Seven countries and territories already have fertility rates below 1.0. Macao stands at 0.70, Hong Kong at 0.75, South Korea at 0.76, Taiwan at 0.86, Puerto Rico at 0.94, and Singapore at 0.97. A TFR below 1.0 means women are having fewer than one child on average over their lifetimes; without immigration, that points to very rapid population decline. Thailand, with its TFR hovering close to 1.1, could join them soon.
India Adding Most People: But with Lowest Fertility Among Top Gainers
Through natural increase (births minus deaths), 1.3 crore people are estimated to be added to India's population in 2026. This is the largest absolute gain for any country. Yet, when analyzed alongside other high-gain nations, a significant paradox emerges: among the top 10 countries adding the most people, India has the lowest fertility rate at 1.9. Bangladesh and Indonesia are also close to the cusp, with fertility rates around the 2.1 replacement level.
| Top Population Gainers (2026) | Births minus deaths (lakh) | Total Fertility Rate (TFR) |
|---|---|---|
| India | 131.0 | 1.9 |
| Pakistan | 53.0 | 3.4 |
| Nigeria | 49.0 | 4.2 |
| DR Congo | 37.0 | 5.8 |
| Ethiopia | 34.0 | 3.7 |
| Bangladesh | 25.0 | 2.1 |
| Indonesia | 22.0 | 2.1 |
| UR Tanzania | 21.0 | 4.4 |
| Egypt | 18.0 | 2.7 |
| Uganda | 15.0 | 4.0 |
At 5.8 children per woman, the Democratic Republic of the Congo (DR Congo) has the highest fertility rate in this group, adding 37 lakh people in 2026. The fact that India adds nearly 3.5 times more people than DR Congo despite having a TFR that is three times lower (1.9 vs 5.8) is a classic illustration of **demographic scale and population momentum** in action.
The Transition Gap: How Long from Replacement Fall to Population Decline?
In Asia, population decline typically begins about 30 years after fertility falls below replacement level—which represents roughly one generation. The transition gap is 24 years in Russia, but only two years in Germany. In most countries, once population decline begins, it turns steep.
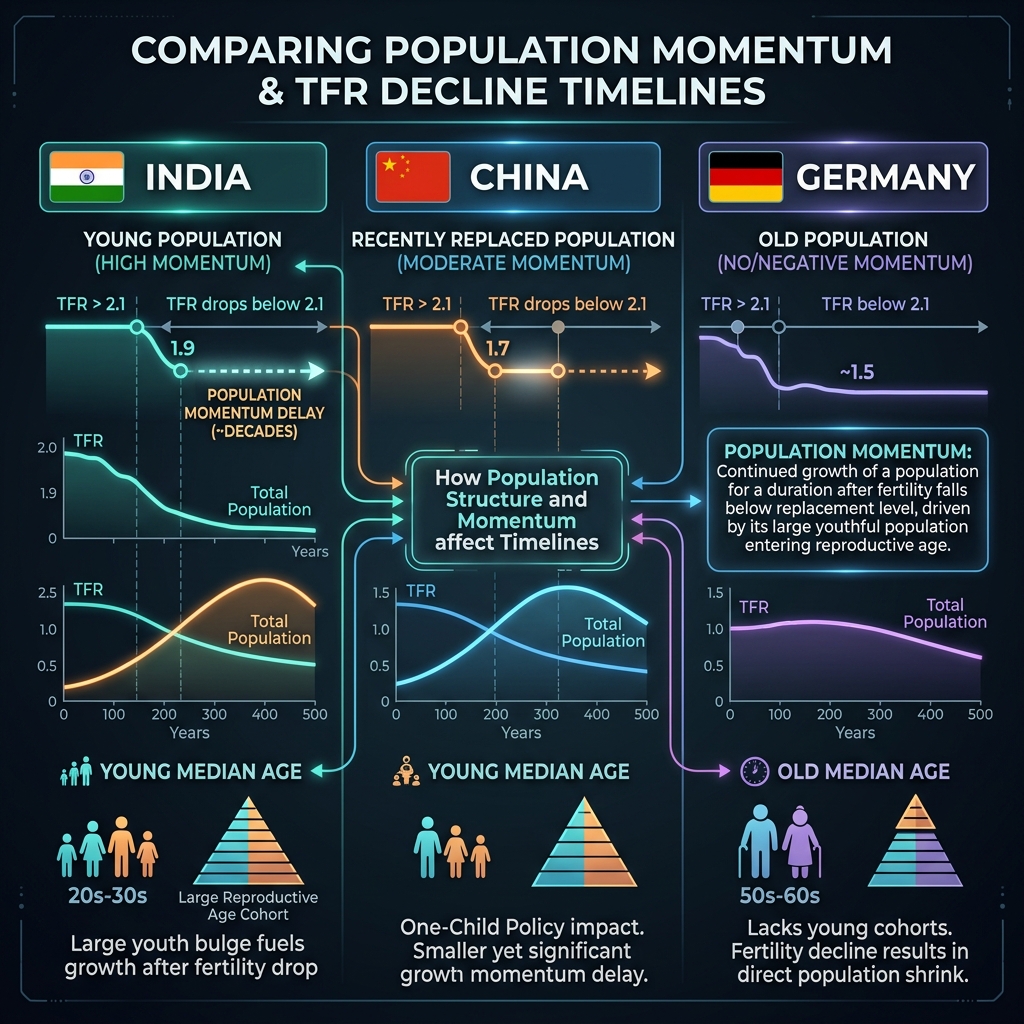
Why did Germany shrink within 2 years of its fertility falling below replacement (1970 to 1972), while China and East Asian nations took 30 years? The delay depends heavily on the initial median age, life expectancy, and infant mortality rates when TFR fell.
Germany was already a demographically old country in 1970, with a median age of 33.2 years vs. China's young median age of 24.1 years in 1991. China reached replacement fertility 21 years after Germany. China in 1991 was a much younger country with middling life expectancy (68.6 years) and relatively high infant mortality. As healthcare improved, infant mortality dropped and life expectancy rose to 78.1 years by 2021, offsetting the drop in births and delaying population shrinkage for three decades.
| Indicator | Germany (1970) | Germany (1972) | China (1991) | China (2021) |
|---|---|---|---|---|
| Total Fertility Rate (TFR) | 2.02 | 1.73 | 1.93 | 1.12 |
| Median Age (Years) | 33.2 | 33.5 | 24.1 | 38.0 |
| Life Expectancy at Birth (Years) | 73.5 | 74.1 | 68.6 | 78.1 |
| Births (000s) | 1,046 | 891 | 22,645 | 10,461 |
| Deaths (000s) | 976 | 965 | 7,782 | 10,760 |
| Net Migrants (000s) | -273 | 336 | -545 | -380 |
When Will India Shrink? Peak Projections and state-Level Disparities
UN population projections estimate that India's population will peak and start shrinking around 2063 under medium-decline scenarios, or around 2047 under steep-decline scenarios. However, India's state-level fertility disparities and structural shifts in family planning indicate that the turning point could arrive earlier than 2047.
A major indicator is the falling median age at last birth in India. A Nature study titled "Changes in Age at Last Birth and Its Determinants in India" (by Mayank Singh, Chander Shekhar, and Neha Shri) found that the median age at last birth has fallen and remained consistently below 30 years since NFHS-3. This reflects a trend of younger marriage-to-childbirth intervals and early sterilization, compressing the reproductive span of Indian women.
1992–93 Survey Phase
Median age at last birth was 32.77 years. Larger families and spaced births led to extended reproductive spans.
1998–99 Survey Phase
Median age at last birth declined to 30.81 years as contraception access and urbanisation expanded.
2005–06 Survey Phase
Median age at last birth crossed below the 30-year threshold to 28.65 years, marking a major cultural shift.
2015–16 Survey Phase
Median age at last birth fell to 27.75 years, driven by rapid declines in desired family sizes.
2019–21 Survey Phase
Median age at last birth reached its lowest point at 27.59 years. Over half of Indian women complete childbearing before age 28.
Because childbearing is compressed into younger age brackets and desired family sizes have fallen (the ideal fertility rate reported by women in NFHS-5 is 1.6), actual birth rates are declining rapidly. Coupled with the fact that Southern states (TFR ~1.5–1.6) and several districts are already shrinking, India's national demographic peak is highly likely to arrive ahead of the UN's 2047 steep-decline estimate.
Frequently Asked Questions
Why is population still growing if fertility is below replacement level?
What is India's current Total Fertility Rate (TFR) and when did it fall below replacement?
What is the Demographic Dividend and what is India's window?
When is India's population expected to start declining?
What is the difference between population decline and population ageing?
GyanGram Editorial Note
This article is based on the explainer "If fertility is below replacement, why is population still growing?" by Atul Thakur, utilizing UN population projections, National Family Health Survey (NFHS) data, and the Singh-Shekhar-Shri Nature study. Formatted for UPSC GS Paper I (Geography/Demography) and GS Paper II preparation.